|
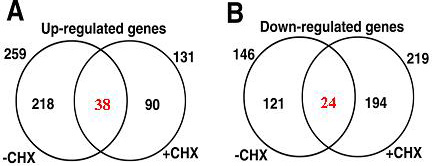
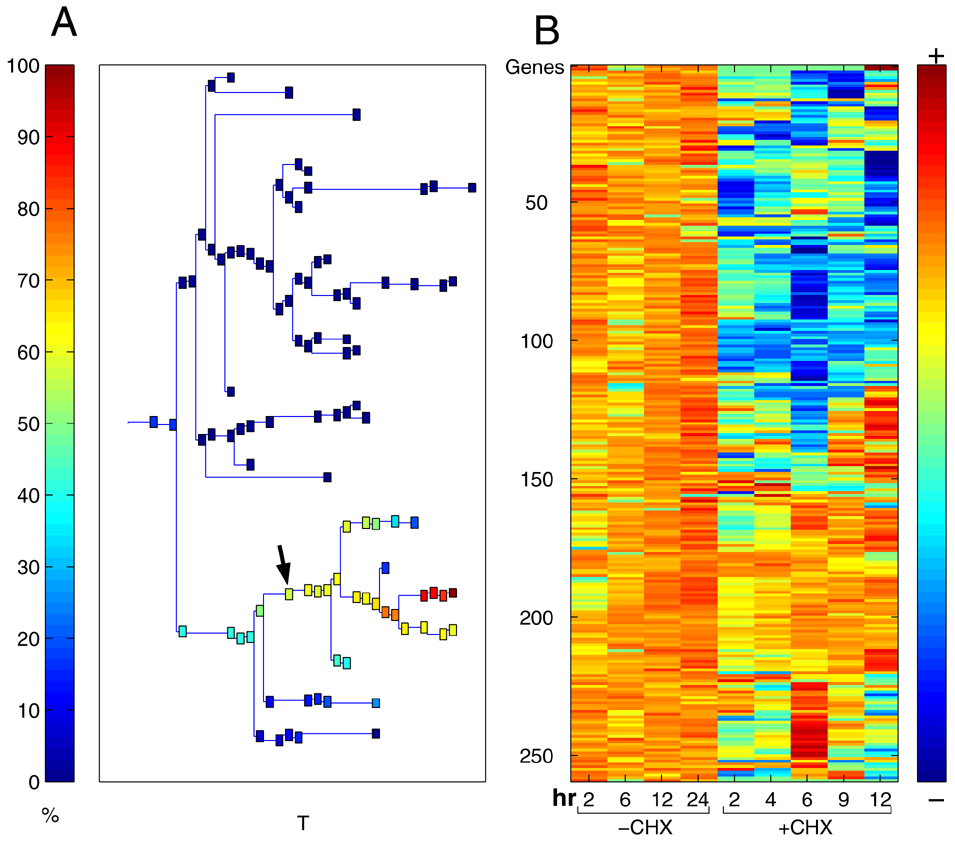
Microarray Analysis of Primary and Secondary Target Genes of p53Figures : Venn Diagram Venn diagram of the number of genes that were regulated by p53 in the presence and absence of CHX. Dendogram Clustering results using super-paramagnetic clustering (SPC) for the 259 genes
that were upregulated in three time points or more upon activation of p53 in the experiment without cycloheximide (CHX). Tables : Table 1 : Primary Target Genes Up Regulated by p53 Table 2 : Primary Target Genes Down Regulated by p53 Supplementary Data : Table 3 : Primary Target Genes Regulated by p53 Table 4 : Secondary Target Genes Regulated by p53 Table 5 : Genes Clustering with Primary Target Genes of p53 Weizmann Institute of Science Department Molecular Cell Biology 76100 Rehovot, Israel Phone: +972-8-934-3634 Fax: +972-8-934-4125 |