|


Laboratory of David Givol
Microarray Comparative Analysis of Primary Targets Genes of p73 and p53
Figures :
Venn Diagram
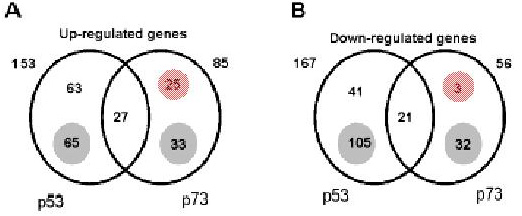
Venn diagram of genes regulated by p53 and p73alpha.
Only genes that showed at least 2-fold up (A) or down (B) regulation at a minimum of 3 time points
as compared with the control were included in the analysis.
The diagram shows that 27 and 21 genes were up- and down-regulated, respectively,
by both p53 and p73alpha. These genes are denoted "common" genes.
The number of genes regulated, respectively, by either p53 or p73alpha are shown in the upper part of the circle,
whereas genes that passed the cutoff (2-fold overexpression at 1 or 2 time points only)
for one of the transcription factors (p73 or p53) are shown in the shaded small circles.
Dendogram
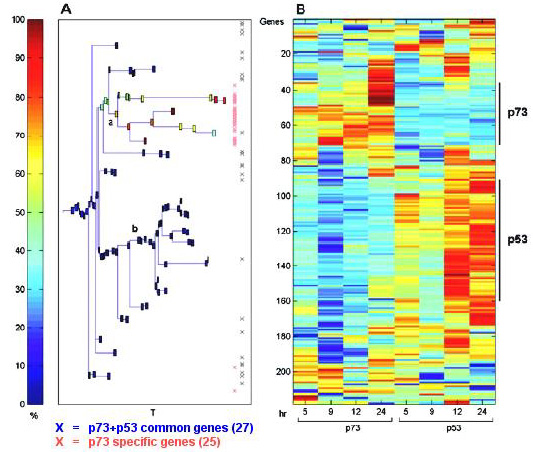
Clustering results using the super-paramagnetic clustering algorithm
for the 211 genes that were up-regulated at 3 or more time points upon ponasterone A activation of p73alpha or p53.
(A) dendrogram of the genes that includes clusters of size 5 and larger.
Each cluster is represented by a box colored according to the percent of p73-only target genes (25 genes) contained in the cluster.
The distribution of these 25 genes is marked by red X's at the right.
The distribution of the common genes (27 genes up-regulated by both p73alpha and p53) is shown by the black X's.
The clusters marked by a and b were used to plot the expression profile of the genes in that cluster (see Fig. 5).
(B) the expression matrix of the genes according to the dendrogram on the left.
The color represents induction (red) or repression (blue).
T is a parameter of the super-paramagnetic clustering algorithm that controls the resolution at which the cluster is found (36).
The genes activated by either p73alpha or p53 as defined by the clustering procedure are shown on the right-hand side of the expression matrix.
Average Expression Profile of Genes in Clusters "a" and "b"
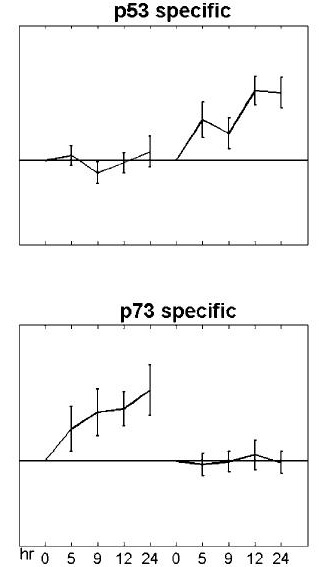
The profiles provide representative examples of the expression profiles of the groups
of genes defined as p73-only (a) and p53-only (b) obtained by the clustering shown above.
In Vivo Recruitment of p73alpha and p53 to Their Target Genes.
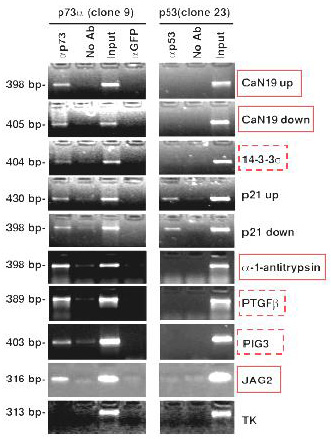
Cross-linked chromatin was extracted either from H1299-p73alpha or H1299-p53
upon induction with ponasterone A and subjected to immunoprecipitation with the indicated antibodies.
The length of the amplified fragment is indicated on the left side.
TK = thymidine kinase.
Tables :
Table 1 :
Target Genes Modulated by p73alpha and p53
Supplementary Data :
Research Interests
TOP
Back to David Givol's Home Page
Weizmann Institute of Science
Department Molecular Cell Biology
76100 Rehovot, Israel
Phone: +972-8-934-3634
Fax: +972-8-934-4125
|